IRAN CONFLICT: GLOBAL MARKETS & INDIA IMPACT ANALYSIS | March 2026
An analysis of oil shocks, market volatility, sectoral winners & losers, and India’s unique vulnerability.
The US-Israel vs Iran conflict has sent shockwaves through every corner of the global economy. The de facto closure of the Strait of Hormuz — through which approximately 20% of the world’s daily oil supply and 22% of global LNG flows — has triggered what commodity strategists are calling the worst energy market crisis since the 1970s oil embargo.
Brent crude has already risen 10–13% to over $80/barrel within days of the strikes. Analysts at RBC Capital Markets, Kpler, and Neuberger Berman warn that prices could breach $100/barrel if the Strait remains disrupted beyond two weeks, and potentially reach $130+ in a worst-case sustained closure. European natural gas prices have nearly doubled. Qatar’s LNG production was paused after drone strikes on its Ras Laffan industrial facilities.
India faces a uniquely severe exposure: 85% of its crude oil is imported, roughly half of that through the Strait of Hormuz, $51 billion in annual Gulf remittances is at risk, and every $1 increase in oil prices costs India approximately $1.8 billion per year. Morgan Stanley has already downgraded the Indian equity market. The Sensex has lost over Rs 11 lakh crore in market capitalisation since the war began.
Part I: The Numbers at a Glance
| +13% Brent Crude Rise Within 72 hours of strikes | 20% Oil Supply at Risk Of global daily supply via Hormuz | 22% LNG Supply at Risk Of global LNG flows via Hormuz | 150+ Tankers Stranded Anchored outside the Strait |
| 1,745 Sensex Fall (Single Day) Points lost, March 4, 2026 | 85% India Crude Import Dep. Of total crude requirement | $51B Gulf Remittances at Risk India’s annual Gulf remittances | $130+ Analysts’ Worst Case Oil Per barrel if Strait stays closed |
Part II: The Strait of Hormuz — The World’s Energy Jugular
No single geographic point has more power to convulse the global economy than the Strait of Hormuz. At its narrowest point — just 33 kilometres wide — this stretch of water between Iran and Oman carries the economic destiny of billions of people who will never see it.
“Hormuz is not merely a tactical lever Iran can threaten or the United States can defend. It is a transmission belt between regional war and the global economy.” — Stimson Center, March 2026
Also read: Blog
What Flows Through the Strait
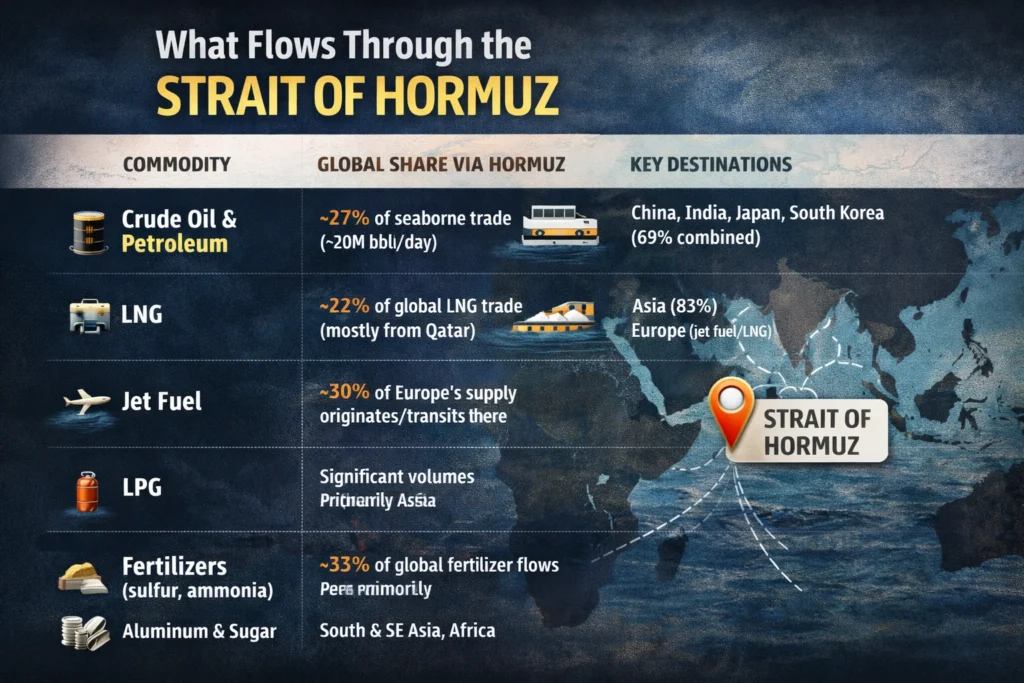
| COMMODITY | GLOBAL SHARE VIA HORMUZ | KEY DESTINATIONS |
| Crude Oil & Petroleum | ~27% of global seaborne trade (~20M bbl/day) | China, India, Japan, South Korea (69% combined) |
| LNG (Liquefied Natural Gas) | ~22% of global LNG trade (mostly from Qatar) | Asia (83%); Europe (jet fuel/LNG) |
| Jet Fuel | ~30% of Europe’s supply originates/transits here | Europe, Asia-Pacific |
| LPG | Significant volumes (India, China key buyers) | Asia primarily |
| Fertilizers (sulfur, ammonia) | ~33% of global fertilizer flows | South & SE Asia, Africa |
| Aluminium & Sugar | Key volumes for Asian markets | India, China, Japan |
Iran achieved its most powerful strategic move not with warships but with drones. A handful of selective strikes near the waterway — not even in the shipping lane itself — were sufficient to cause insurance companies to withdraw coverage for vessels transiting the corridor. Without insurance, tanker owners face catastrophic financial exposure. The result: over 150 vessels anchored outside the Strait, traffic falling to near-zero, and a de facto closure achieved at minimal military cost.
“All Iran had to do was several drone strikes in the vicinity of the Strait of Hormuz, and all of a sudden, insurers and shipping companies decided it was unsafe to traverse that very narrow S-curve of that waterway.” — Helima Croft, RBC Capital Markets
On 2 March 2026, an IRGC commander officially confirmed the Strait was ‘closed’ and threatened to set ablaze any vessel attempting passage. By that date, AIS (vessel tracking) signals from tankers had already dropped to near-zero. Protection and indemnity insurance was formally withdrawn from 5 March, making any transit commercially impossible for most operators.
Part III: Global Market Impact — Winners, Losers & Shockwaves
Oil & Energy Markets
The immediate oil price response was sharp but, analysts warn, the worst may be ahead. Brent crude rose from approximately $70 to $80–82/barrel within the first 72 hours — a 10–13% surge driven entirely by fear premium. Physical supply disruptions have not yet fully materialised as some Gulf producers had front-loaded shipments in anticipation. The question markets are now pricing is duration.
“A full or near-full closure lasting a month or more would require demand destruction at levels that could push crude well into triple digits and European natural gas prices toward or above the crisis levels seen in 2022.” — Hakan Kaya, Senior Portfolio Manager, Neuberger Berman
Iraq — a major oil producer — has been forced to shut down production in its largest fields because, with the Strait closed, it has nowhere to export the oil. Qatar paused LNG production after drone strikes on the Ras Laffan and Mesaieed industrial areas, causing European gas prices to nearly double before partial recovery.
Equity Markets — Global Reaction
Global equity markets reacted with a sharp ‘risk-off’ rotation. Investors moved to safe-haven assets — gold surged, the US dollar strengthened, Japanese yen and Swiss franc appreciated. Equity indices in oil-importing nations fell hardest. Airlines, automotive, chemical, and consumer-dependent sectors saw the sharpest declines. Defence stocks rose.
“The scale of what is at stake cannot be overstated.” — Hakan Kaya, Neuberger Berman
Country-by-Country Impact Matrix
| ECONOMY | EXPOSURE TYPE | KEY RISKS / IMPACTS | SEV. |
| India | Energy + Remittances + Trade | 85% crude import dependence; ~50% via Hormuz; $51B remittances at risk; Sensex fell 1,745 pts; rupee weakened; Morgan Stanley downgrade | HIGH |
| China | Energy Supply | 50% of crude imports from Gulf; $100B+ invested in Iran; moderating Russian crude now likely to reverse; broader inflation risks | HIGH |
| Japan | Energy Security | 95% of crude from Gulf; 70% transits Hormuz; refiners requesting government reserve releases | HIGH |
| South Korea | Energy + Manufacturing | Heavy dependence on Gulf crude; petrochemical sector heavily exposed; inflation pressure rising | HIGH |
| Europe | LNG + Jet Fuel | Eurozone growth cut by 0.1%; inflation up 0.5%; natural gas prices nearly doubled after Qatar LNG pause; 30% of jet fuel at risk | MED |
| United States | Oil Prices + SPR | Buffered by domestic production; can tap Strategic Petroleum Reserve; some inflation risk; Trump said ‘if they rise, they rise’ | MED |
| Russia | WINNER | Middle East supply disruption improves competitive position; both India and China incentivised to buy more Russian crude immediately | GAIN |
| Saudi Arabia / UAE | Infrastructure Risk | Iranian missile strikes targeting Gulf infrastructure; both have partial bypass pipelines; some production disruptions possible | MED |
| Pakistan | Energy + Border | Reliant on imported oil; requested Saudi oil rerouting via Yanbu; two-front war risk on Iranian border (Balochistan) | HIGH |
| Central Asia | Trade Routes | Iranian ports critical for sea access; trade routes to Indian Ocean severed; inflation and freight cost spikes | MED |
Part IV: Sectoral Winners & Losers — Global View
| SECTOR | STATUS | RATIONALE | EXAMPLES |
| Oil & Gas Producers (non-Gulf) | WINNER | Higher oil prices directly benefit upstream producers outside the conflict zone | ExxonMobil, Shell, ONGC, Cairn India |
| Defence & Aerospace | WINNER | War drives government defence spending and weapons procurement orders globally | L&T Defence, HAL, Elbit Systems, Raytheon |
| Gold & Precious Metals | WINNER | Classic safe-haven rush; gold prices surged as equity risk aversion rose globally | Gold ETFs, Sovereign Gold Bonds, miners |
| Airlines & Aviation | LOSER | Airspace closures, fuel cost surge; 4,000+ daily flights cancelled; Middle East routes suspended | Air India, IndiGo, Emirates, Qatar Airways |
| Oil Marketing Companies | LOSER | Higher crude costs compress refining margins unless retail prices raised; political pressure to absorb cost | HPCL, BPCL, Indian Oil Corporation |
| Automobiles | LOSER | Higher fuel and petrochemical input costs; consumer sentiment hit; fleet economics worsen | Maruti, Tata Motors, Hyundai India |
| Chemicals & Paints | LOSER | Petrochemical feedstock costs surge with crude prices; margin compression across sector | Asian Paints, Berger, Pidilite |
| Fertilizer & Agriculture | LOSER | 30% of ammonia, 50% of urea production at risk; food inflation downstream consequence | Chambal Fertilisers, GSFC, Coromandel |
| Shipping (Tankers) | MIXED | Tanker rates surge 250K+ per voyage; but operators unable to transit Hormuz; only non-Gulf routes benefit | Great Eastern Shipping |
| Pharma & Healthcare | RESILIENT | Largely insulated from oil prices; domestic demand-driven; may benefit from defensive rotation | Sun Pharma, Dr Reddy’s, Cipla |
| IT & Technology | RESILIENT | No direct oil exposure; mild FII outflow risk; rupee depreciation marginally boosts export revenues | TCS, Infosys, Wipro, HCL Tech |
| Russia’s Energy Sector | WINNER | Entire Middle East disruption shifts both India and China toward Russian crude urgently | Rosneft, Gazprom Neft |
Part V: India — A Nation in the Crosshairs
India is the country most exposed among major economies to the Iran war’s economic fallout. It sits at the intersection of four simultaneous vulnerabilities: an oil import crisis, a remittances crisis, a currency crisis, and an equity market crisis — none of which it can easily control from New Delhi.
1. The Oil Crisis
“It is bad timing for India. India’s oil purchases will be under the microscope.” — Ellen Wald, President, Transversal Consulting
India imports nearly 85% of its crude oil — approximately 4.7–4.9 million barrels per day. Of that, vessel tracking data from Nomura suggests roughly 50% currently transits the Strait of Hormuz. Nearly 46% of India’s total crude comes from Saudi Arabia, Iraq, the UAE, and Kuwait — all suppliers whose exports also transit conflict-prone routes.
The arithmetic is stark: every $1 rise in oil prices adds approximately $5 million to India’s daily import bill — nearly $1.8 billion annually. If prices remain $10/barrel higher for a full year, India’s import bill could rise by $18 billion — roughly 0.5% of GDP. India currently has only 25–50 days of crude supply on hand.
2. The Russian Oil Dilemma
India’s energy situation is complicated by a geopolitical tightrope it has been walking for months. Under an interim trade deal with the United States, India committed to stop importing Russian oil — the punitive US tariff of 25% on Indian exports was removed in exchange. Now, with Middle East supply disrupted, India faces an impossible choice: return to Russian oil (cheaply available) or pay a premium for alternative supplies while straining its trade relationship with Washington.
India imported 1.16 million bpd of Russian crude in the weeks before the war — well below its 2025 average of 1.71 million bpd — as it was shifting to Middle Eastern supply. That shift is now in jeopardy. Analysts at Rystad Energy note that ‘a significant volume of Russian crude of the appropriate grade is already available on water’ — making a resumption of Russian imports a near-inevitability, whatever the diplomatic consequences.
3. The Remittances Crisis
India is the world’s largest recipient of remittances. The Gulf region accounts for approximately 38% of total inflows — equivalent to $51.4 billion in FY2025. Indian workers in the Gulf are concentrated in oil services, construction, hospitality, and retail — precisely the sectors most vulnerable to regional economic disruption.
“A sharp decline in remittance inflows — particularly if combined with higher oil prices due to the conflict — would worsen India’s external position and could put some pressure on the rupee.” — Citi Research Note, March 2026
If the conflict lasts beyond six months, S&P Global’s Deepa Kumar warned that the impact on the Indian economy would become material. Special evacuation flights from Riyadh have already begun returning Indian workers to New Delhi.
4. Currency & Markets
The rupee has weakened sharply against the dollar since the conflict began — a consequence of dollar strengthening driven by global risk aversion, combined with India-specific concerns about the current account deficit widening from higher oil prices. HDFC Bank warned that even without a physical supply disruption, near-term oil price spikes could pressure the rupee and widen the CAD — currently projected at around 1% of GDP for FY2026–27. A sustained $10/barrel oil increase could widen it by 40–50 basis points.
The Sensex plunged 1,745 points (2.17%) in a single session on 4 March, with the Nifty50 falling 531 points. Analysts estimate over Rs 11 lakh crore has been wiped from Indian market capitalisation since the war began. Morgan Stanley downgraded India equities to equal weight, citing oil supply risks. Goldman Sachs warned a 20% rise in Brent crude would cut Asian earnings by 2%, with India the hardest hit in the region.
“Prolonged tensions among the United States, Israel, and Iran are mounting pressure on India across its current account, inflation outlook, and currency stability.” — Devarsh Vakil, Head of Prime Research, HDFC Securities
5. India’s Sectors: Who Wins and Who Loses
| INDIA SECTOR | STATUS | DETAIL |
| Oil Marketing (HPCL, BPCL, IOC) | LOSER | Caught between crude cost surge and government pressure to limit retail price hikes. Margin compression severe. |
| Airlines (Air India, IndiGo) | LOSER | Airspace closures over Gulf; fuel costs up; Middle East route suspension; immediate revenue loss. |
| Automobiles & Tyres | LOSER | Higher crude inflates rubber, petrochemical inputs; consumer sentiment weakening. |
| Chemicals & Paints | LOSER | Petrochemical feedstock directly linked to crude prices. Asian Paints, Pidilite face margin pressure. |
| Fertilizers (Chambal, GSFC) | LOSER | Ammonia and urea supply at risk through Hormuz; domestic food inflation consequence. |
| Banks with Gulf Exposure (HDFC) | STRESS | Deposit mobilisation from NRI Gulf accounts at risk; remittance inflow slowdown. |
| L&T (Gulf Infra Projects) | STRESS | Substantial ongoing contracts in Gulf states now disrupted; project delays possible. |
| Pharma (Sun, Dr Reddy’s) | RESILIENT | Domestic demand-driven; limited oil exposure; defensive sector in volatile times. |
| IT (TCS, Infosys, Wipro) | RESILIENT | No direct oil exposure; rupee depreciation slightly boosts dollar-denominated revenues. |
| Defence (HAL, L&T Defence) | WINNER | War triggers domestic defence procurement acceleration; Modi government has military spending boost rationale. |
| ONGC / Cairn India | WINNER | Higher oil price directly boosts upstream E&P revenues on domestic production. |
| Gold Jewellery / Retailers | MIXED | Gold price surge benefits holders; but supply disruption via Dubai route creates short-term friction. |
Part VI: Economic Scenarios — What Happens Next?
Scenario A: Rapid Ceasefire (1–2 Weeks)
Strait reopens quickly. Brent settles at $75–80/barrel. India’s CAD widens modestly; rupee stabilises; equity markets recover partially. Remittances disruption contained. This is the best-case scenario for India’s economy and requires a rapid political settlement that currently appears very unlikely.
Scenario B: Contained War (4–8 Weeks — Base Case)
The conflict remains primarily air-based. The Strait is partially reopened by US naval escort within 2–3 weeks. Brent holds at $80–90/barrel. India’s oil import bill rises by $10–15 billion. Rupee weakens to 87–90/USD. Inflation rises 50–80 bps. RBI may delay rate cuts. Markets remain volatile but avoid a structural collapse. Remittances fall 10–15%.
Scenario C: Prolonged Conflict (2–6 Months — Tail Risk)
The Strait remains effectively closed for 6+ weeks. Brent hits $100–130/barrel. India’s annual oil import bill surges by $18–30 billion. CAD widens to 2–2.5% of GDP. Rupee could weaken to 90+/USD. RBI forced into defensive rate actions. Sensex falls another 10–15%. Remittances drop significantly as Gulf economies contract. S&P revises India’s growth outlook downward from 7% to 5.5–6%.
“A prolonged closure of the Strait of Hormuz is a guaranteed global recession.” — Robert McNally, Oil Market Analyst
Part VII: India’s Policy Response — What New Delhi Can Do
Energy Diversification
India’s strategic imperative is to reduce its Hormuz dependence. In the short term, this means pivoting to alternative suppliers: US LNG (under the new bilateral trade framework), increased West African crude, accelerated pipeline discussions with Central Asia. The irony is that the easiest short-term fix — resuming Russian crude imports — may come with US sanctions risk.
Rupee Stabilisation
The RBI has significant foreign exchange reserves — approximately $640 billion before the conflict. Intervention to prevent excessive rupee depreciation is available, but must be deployed judiciously. The real risk is if the conflict triggers sustained FII outflows, which would require both FX intervention and interest rate signalling.
SPR & Emergency Stocks
India’s Strategic Petroleum Reserve holds approximately 5.33 million tonnes of crude at three underground facilities (Vishakhapatnam, Mangalore, Padur). These can buffer a supply disruption of roughly 9.5 days at current import rates — modest, but sufficient to manage short-term supply shocks.
Diplomatic Positioning
India’s government has convened high-level stakeholder consultations involving the Ministry of Commerce, RBI, logistics operators, and oil ministries. New Delhi’s official position has been cautious neutrality — calling for de-escalation without condemning the US-Israel strikes. This balancing act — maintaining ties with Washington and Gulf states while preserving the option of Russian energy purchases — will define India’s diplomatic agility in the weeks ahead.
References & Further Reading
Kpler — Strait of Hormuz Crisis Reshapes Global Oil Markets
Bloomberg — Oil Shock from Iran War Raises Risks for India’s Stock Market
Business Standard — Sensex, Nifty Tumble on US-Israel-Iran War
See Article I for the military, political and strategic background to this conflict.